Data & AI · 5 August 2026 · 28 min read
Simulated Annealing, Live
An interactive introduction to simulated annealing: watch a ball escape local minima as you control the temperature, then race four algorithms live on the Travelling Salesman Problem in your browser.
Simulated Annealing, Live
The star of the show is simulated annealing, which I love the metaphor for. When I went to Disney some 12 years ago, I saw a live performance of an artist shaping molten glass into the shape of Mickey Mouse. It's a fascinating art, known as annealing: where you, a blacksmith or glassblower, heat up your material till it's incredibly hot, often a striking red color, then shape it as you please, and cool it strategically. As it cools, it hardens, so you have a more flexible material the hotter it is, and less so the cooler it is. This post shows a metaphor of this in optimization known as Simulated Annealing, it's a short algorithm that solves problems by exploring a search space of a problem (shaping the material that is wet and goopy), then cooling down as better solutions are found, modifying the medium less and less until you have a solution.
Quick jargon guide
- Local optimum: a solution better than all its neighbours but not the best overall. The dip a greedy search falls into and can never leave.
- Simulated annealing (SA): a search that sometimes accepts worse solutions, with a tolerance ("temperature") that starts high and slowly cools, letting it escape local optima early and commit late.
- Cooling schedule: the recipe for how fast the temperature drops. Too fast and you're just a hill climber; too slow and you never settle.
- Travelling Salesman Problem (TSP): given a set of cities, find the shortest round trip visiting each once. The classic hard optimization problem.
- NP-hard: a class of problems where no known method finds guaranteed-best answers efficiently as size grows, so practical work means excellent-not-certified answers.
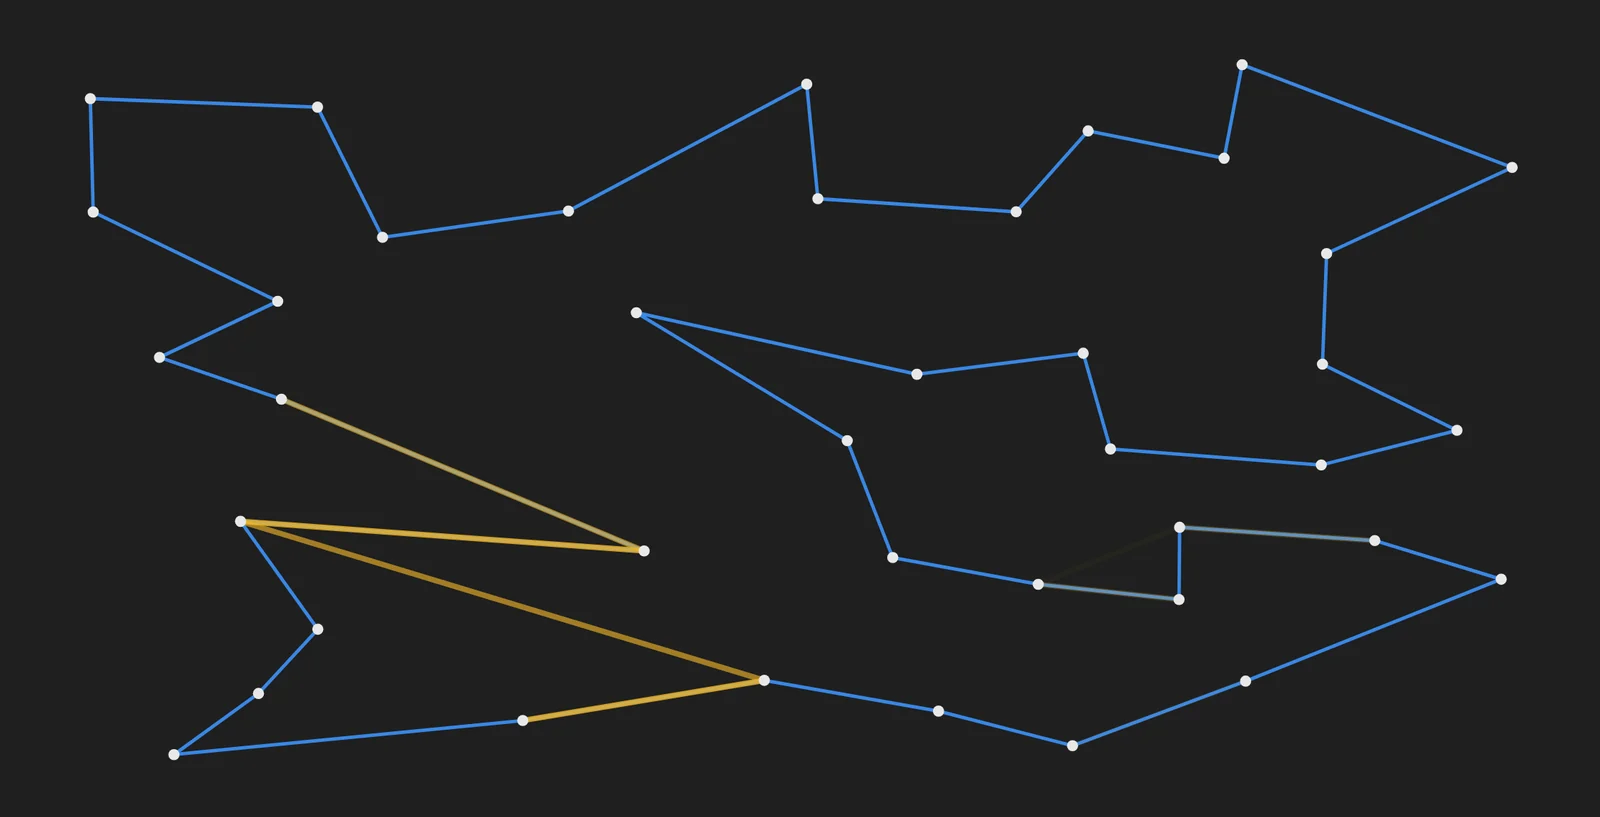
- 2-opt move: a small edit to a tour: pick two of its edges, reconnect them the other way round. The basic step all the movers in the race use.
- Evaluation: one call to the scoring function ("how long is this tour?"). The fair currency for comparing search algorithms, everyone gets the same number of questions.
- Metaheuristic: the umbrella term for general-purpose search strategies like annealing, hill climbing, and genetic algorithms that make few assumptions about the problem.
The problem: greed gets stuck
Imagine a marble rolling on a bumpy curve, trying to find the lowest point. The obvious strategy is "only ever move downhill". This is the spirit of gradient descent and hill climbing, but the first dip the marble lands in, it stays in. Nearby there may be a valley ten times deeper, but it will never see it, because getting there requires briefly going up.
Metallurgists solved this problem for atoms centuries before computer scientists had it: cool molten metal too fast and its atoms freeze wherever they happen to be, full of internal stress: a brittle mess stuck in a bad arrangement. But cool it slowly, annealing it, and the atoms, still hot enough to jiggle out of bad positions, gradually settle into a low-energy crystal. Randomness, early on, is what lets the system escape bad arrangements; the slow cooling is what lets it eventually commit to a good one.
In 1983, Kirkpatrick, Gelatt and Vecchi published the algorithmic version in Science[1] (Černý found it independently[2]), building on a Monte Carlo method physicists had used since 1953.[3] The recipe: search like a hill climber, but when a proposed move is worse, don't always refuse. Accept it with probability P = exp(−Δ/T), where Δ is how much worse and T is a temperature you slowly lower. Hot: almost anything goes, the search bounces freely across the landscape. Cold: only improvements survive, and the algorithm hardens into a plain hill climber.
Play with it: the marble and the thermostat
Below are two marbles on the same bumpy curve, started at the same spot. The green one is a pure hill climber: it only accepts downhill moves. The blue one anneals: you hold its thermostat. Run it a few times. Watch the greedy marble find the nearest dip and retire there, while the hot marble rattles across the whole curve; then drag the temperature down (or let auto-cool do it) and watch the blue marble crystallise, usually somewhere much deeper. The small dots mark the best point each marble has ever found. The strip under the curve records your run as you go: the temperature you are holding in amber and, in blue, the fraction of uphill moves the annealer is accepting, which is P = exp(−Δ/T) made visible.
Both marbles propose the same size of random step; the only difference is the acceptance rule. Depth readouts show each marble's best-ever height (lower is better).
The strip is the flight recorder: temperature in amber, the share of uphill proposals being accepted in blue, and in the corner the live Metropolis odds for a typical uphill step.
The blue marble isn't smarter, it's just temporarily tolerant of bad moves, on a schedule. And that single tweak converts the world's dumbest algorithm into one that, given a sensible cooling schedule, provably converges toward global optima and, more importantly, finds excellent solutions to real industrial problems in practice.
The main event: four algorithms, one map
Travelling Salesman Problem: given a set of cities, find the shortest round trip that visits each once. It's the classic NP-hard problem, the number of possible tours explodes factorially (30 cities is already ~1030 tours), and it's the kind of discrete, gradient-free terrain I wrote about in the previous post.
The racers, each in its lane colour:
- Simulated annealing: as above; proposes 2-opt moves (pick two edges of the tour, reconnect them the other way[4]), accepting bad ones on the cooling schedule.
- Hill climber, same 2-opt moves, zero tolerance: improvements only.
- Genetic algorithm: a population of 40 tours; tournament selection, order crossover, swap mutation, elitism. The napkin algorithm from my GA post.
- Random search, shuffles a fresh tour every try and keeps the best. The floor. Somebody has to be it.
The race is scored in evaluations, not iterations. Every time any algorithm asks "how long is this tour?", its meter ticks. The GA evaluates 40 tours per generation, so it gets fewer generations; the annealer evaluates one tour per step, so it gets many steps.
Changing cities re-deals the map. Cooling speed is how aggressively temperature decays over the race (higher = colder sooner). Mutation is the % chance each GA child gets a random swap. Changes reset the race so it stays fair.
The strip between the chart and the scoreboard is the annealer's telemetry, on the same evaluations axis: the faint amber curve is the planned cooling schedule, the solid amber line is the temperature spent so far (as a % of its starting value), and blue is the share of uphill moves accepted in each stretch.
All four algorithms share one budget currency: tour-length evaluations (200,000 each per race).
What to watch for
Every race is different (the map is random, and so are the algorithms), but a few patterns recur:
The hill climber sprints, then flatlines. Early on, greed looks brilliant: almost every 2-opt move on a random tour is an improvement, so the green line dives. Then it hits a tour where no single 2-opt move helps, a local optimum, and the line goes horizontal forever. Sometimes it gets lucky and the flatline is a good tour.
The annealer loses the early race, but that's by design. While hot, it accepts terrible moves, and its curve dawdles above the hill climber's. It's supposed to look bad early. It's spending the early budget on exploration, when the cooled annealer keeps improving long after the hill climber has frozen, and the blue line crosses below the green one. If you set cooling speed too high in the playground, you can watch that advantage die: quench it, and it becomes a hill climber with a lot more code! The telemetry strip under the chart shows it happening: while the amber temperature line is up the blue acceptance trace rides high too, and the moment amber flattens near zero, blue dies with it, leaving the annealer greedy from then on.
The GA is the tortoise. Forty tours sharing a budget means it always looks slow per-evaluation, and on a problem this small, 2-opt moves are so effective that the population approach rarely wins the sprint. But watch how steadily it improves, and how rarely it gets truly stuck: the population is insurance against the trap that eats the hill climber. On bigger, nastier, more constrained problems, that insurance is essential, and that is where my own field lives.
Random search is bad. It might find a great solution but it doesn't follow any strategy to improve upon. Every (real) metaheuristic beats random.
Why Simulated Annealing is still relevant
Simulated annealing is over forty years old, has no learned components, no data, no gradients, and can be setup in a couple of minutes. It is also, right now, in production: routing chips, scheduling factories and hospitals, packing containers, planning telescope observations. Its longevity comes from the same property that made the marble demo work: it makes almost no assumptions about the problem. Anything you can score and perturb, you can anneal, which in practice means nearly everything with discrete parts and hard constraints, the terrain where gradient methods can't get a foothold. It requires no training data or understanding of a problem, just some means to measure "goodness".
I also like the general philosophy of it: explore wildly at the beginning, become pickier over time, and always remember the most important solution found. It's one of the best examples of "exploration vs. exploitation", a concept applicable to all optimization problems, and to life in general: explore while you can and make use of your search to find the best for you. Settling too early or too late is unwise, and always be willing to consider a better option.
Download the standalone demos
The algorithms (JavaScript)
/* ============================================================
Simulated Annealing, Live, all demo code for this post.
No dependencies. Everything renders to <canvas> and reads its
colours from the CSS custom properties on.kr-viz, so the
site's light/dark theme toggle restyles the demos live.
============================================================ */
(function() {
'use strict';
function mulberry32(seed) {
var a = seed >>> 0;
return function() {
a |= 0;
a = (a + 0x6D2B79F5) | 0;
var t = Math.imul(a ^ (a >>> 15), 1 | a);
t = (t + Math.imul(t ^ (t >>> 7), 61 | t)) ^ t;
return ((t ^ (t >>> 14)) >>> 0) / 4294967296;
};
}
function vizColors(el) {
var cs = getComputedStyle(el);
function v(name) {
return cs.getPropertyValue(name).trim();
}
return {
series: [v('--viz-s1'), v('--viz-s2'), v('--viz-s3'), v('--viz-s4')],
ink: v('--viz-ink'),
muted: v('--viz-muted'),
grid: v('--viz-grid'),
surface: v('--viz-surface')
};
}
function fitCanvas(cv) {
var dpr = window.devicePixelRatio || 1;
// the height attribute is the desktop height; on narrow screens clamp tall
// canvases to a sane aspect (never below 180px) while short telemetry
// strips keep their declared height
var w = cv.clientWidth;
var h = Math.min(parseInt(cv.getAttribute('height'), 10), Math.max(180, Math.round(w * 0.75)));
cv.style.height = h + 'px';
cv.width = Math.round(w * dpr);
cv.height = Math.round(h * dpr);
var ctx = cv.getContext('2d');
ctx.setTransform(dpr, 0, 0, dpr, 0, 0);
return ctx;
}
/* ============================================================
Widget A: the marble and the thermostat
============================================================ */
(function marbleDemo() {
var wrap = document.getElementById('curve-demo');
if (!wrap) return;
var cv = document.getElementById('curveCanvas');
var runBtn = document.getElementById('curveRun');
var resetBtn = document.getElementById('curveReset');
var tempSlider = document.getElementById('curveTemp');
var tempVal = document.getElementById('curveTempVal');
var autoCool = document.getElementById('curveAuto');
var strip = document.getElementById('curveStrip');
var ctx = fitCanvas(cv);
var stripCtx = fitCanvas(strip);
var STRIP_N = 480; // rolling telemetry window, ~8s of frames
var running = false,
rafId = null;
var rng = mulberry32(12345);
function f(x) {
return 0.32 * Math.sin(x * 9) +
0.18 * Math.sin(x * 23 + 1.7) +
0.10 * Math.sin(x * 41 + 0.4) +
1.6 * (x - 0.72) * (x - 0.72);
}
var F_MIN = -0.55,
F_MAX = 1.15; // plotting range
var T_MAX = 0.4;
var state;
function reset() {
var x0 = 0.05 + rng() * 0.9;
state = {
hc: {
x: x0,
best: x0,
bestF: f(x0)
},
sa: {
x: x0,
best: x0,
bestF: f(x0)
},
T: (tempSlider.value / 100) * T_MAX,
hist: [],
accEma: null,
dEma: null
};
tempSlider.value = Math.round(state.T / T_MAX * 100);
draw();
}
function px(x, W) {
return 14 + x * (W - 28);
}
function py(y, H) {
return 16 + (1 - (y - F_MIN) / (F_MAX - F_MIN)) * (H - 44);
}
function step() {
var SIGMA = 0.02,
STEPS = 26;
var upProp = 0,
upAcc = 0,
upSum = 0;
for (var i = 0; i < STEPS; i++) {
// hill climber
var nx = Math.min(1, Math.max(0, state.hc.x + (rng() * 2 - 1) * SIGMA));
if (f(nx) <= f(state.hc.x)) state.hc.x = nx;
if (f(state.hc.x) < state.hc.bestF) {
state.hc.bestF = f(state.hc.x);
state.hc.best = state.hc.x;
}
// annealer (uphill proposals are tallied for the telemetry strip)
var sx = Math.min(1, Math.max(0, state.sa.x + (rng() * 2 - 1) * SIGMA));
var d = f(sx) - f(state.sa.x);
if (d <= 0) {
state.sa.x = sx;
} else {
upProp++;
upSum += d;
if (state.T > 1e-6 && rng() < Math.exp(-d / state.T)) {
state.sa.x = sx;
upAcc++;
}
}
if (f(state.sa.x) < state.sa.bestF) {
state.sa.bestF = f(state.sa.x);
state.sa.best = state.sa.x;
}
if (autoCool.checked) {
state.T *= 0.99965;
tempSlider.value = Math.round(state.T / T_MAX * 100);
}
}
// smooth the tallies into the telemetry (EMA so the traces don't jitter)
if (upProp) {
var K = 0.15;
var rate = upAcc / upProp;
state.accEma = state.accEma === null ? rate : state.accEma + K * (rate - state.accEma);
var dbar = upSum / upProp;
state.dEma = state.dEma === null ? dbar : state.dEma + K * (dbar - state.dEma);
}
state.hist.push({
t: state.T / T_MAX,
a: state.accEma === null ? 1 : state.accEma
});
if (state.hist.length > STRIP_N) state.hist.shift();
}
function draw() {
var c = vizColors(wrap);
var W = cv.clientWidth,
H = cv.clientHeight;
ctx.clearRect(0, 0, W, H);
// curve
ctx.beginPath();
for (var i = 0; i <= 300; i++) {
var x = i / 300,
X = px(x, W),
Y = py(f(x), H);
if (i === 0) ctx.moveTo(X, Y);
else ctx.lineTo(X, Y);
}
ctx.strokeStyle = c.muted;
ctx.lineWidth = 2;
ctx.stroke();
// best markers
[
['hc', c.series[1]],
['sa', c.series[0]]
].forEach(function(pair) {
var a = state[pair[0]];
ctx.beginPath();
ctx.arc(px(a.best, W), py(f(a.best), H), 3.5, 0, Math.PI * 2);
ctx.fillStyle = pair[1];
ctx.globalAlpha = 0.45;
ctx.fill();
ctx.globalAlpha = 1;
});
// marbles (annealer drawn second, with a surface ring so overlaps stay legible)
[
['hc', c.series[1]],
['sa', c.series[0]]
].forEach(function(pair) {
var a = state[pair[0]];
ctx.beginPath();
ctx.arc(px(a.x, W), py(f(a.x), H) - 8, 8, 0, Math.PI * 2);
ctx.fillStyle = pair[1];
ctx.fill();
ctx.lineWidth = 2;
ctx.strokeStyle = c.surface;
ctx.stroke();
});
// readouts (text in ink, swatch carries identity)
ctx.font = '12px Poppins, sans-serif';
ctx.fillStyle = c.series[0];
ctx.fillRect(14, 10, 9, 9);
ctx.fillStyle = c.ink;
ctx.fillText('annealer best: ' + state.sa.bestF.toFixed(3), 28, 19);
ctx.fillStyle = c.series[1];
ctx.fillRect(14, 26, 9, 9);
ctx.fillStyle = c.ink;
ctx.fillText('greedy best: ' + state.hc.bestF.toFixed(3), 28, 35);
tempVal.textContent = 'T = ' + state.T.toFixed(3);
drawStrip();
}
// the flight recorder: temperature (amber) and share of uphill proposals
// accepted (blue) over a rolling window, both on one 0-100% scale
function drawStrip() {
var c = vizColors(wrap);
var W = strip.clientWidth,
H = strip.clientHeight;
var padL = 14,
padR = 78,
padT = 10,
padB = 8;
stripCtx.clearRect(0, 0, W, H);
function X(i) {
return padL + (i / (STRIP_N - 1)) * (W - padL - padR);
}
function Y(v) {
return padT + (1 - v) * (H - padT - padB);
}
stripCtx.font = '11px Poppins, sans-serif';
[0, 0.5, 1].forEach(function(v) {
stripCtx.strokeStyle = c.grid;
stripCtx.lineWidth = 1;
stripCtx.beginPath();
stripCtx.moveTo(padL, Y(v));
stripCtx.lineTo(W - padR, Y(v));
stripCtx.stroke();
});
var start = STRIP_N - state.hist.length;
[
['t', c.series[2]],
['a', c.series[0]]
].forEach(function(pair) {
if (!state.hist.length) return;
stripCtx.beginPath();
state.hist.forEach(function(h, i) {
var x = X(start + i),
y = Y(h[pair[0]]);
if (i === 0) stripCtx.moveTo(x, y);
else stripCtx.lineTo(x, y);
});
stripCtx.strokeStyle = pair[1];
stripCtx.lineWidth = 2;
stripCtx.stroke();
});
// live end labels (ink text, coloured dot), nudged apart if they collide
var labels = [{
y: Y(state.T / T_MAX),
color: c.series[2],
text: 'T ' + Math.round(state.T / T_MAX * 100) + '%'
}];
if (state.accEma !== null) labels.push({
y: Y(state.accEma),
color: c.series[0],
text: 'uphill ' + Math.round(state.accEma * 100) + '%'
});
labels.sort(function(p, q) {
return p.y - q.y;
});
labels.forEach(function(l) {
l.y = Math.max(padT + 5, Math.min(H - padB - 3, l.y));
});
if (labels.length === 2 && labels[1].y - labels[0].y < 13) labels[0].y = labels[1].y - 13;
labels.forEach(function(l) {
var x = W - padR + 6;
stripCtx.beginPath();
stripCtx.arc(x + 4, l.y, 3.5, 0, Math.PI * 2);
stripCtx.fillStyle = l.color;
stripCtx.fill();
stripCtx.fillStyle = c.ink;
stripCtx.fillText(l.text, x + 11, l.y + 4);
});
// the Metropolis rule with live numbers, for a typical uphill step
// (surface-coloured halo keeps it legible when the traces run hot)
if (state.dEma !== null) {
var p = state.T > 1e-6 ? Math.exp(-state.dEma / state.T) : 0;
var txt = 'typical uphill Δ ' + state.dEma.toFixed(3) +
' · P(accept) ' + Math.round(p * 100) + '%';
stripCtx.strokeStyle = c.surface;
stripCtx.lineWidth = 3;
stripCtx.strokeText(txt, padL + 4, padT + 12);
stripCtx.fillStyle = c.muted;
stripCtx.fillText(txt, padL + 4, padT + 12);
}
}
function loop() {
if (!running) return;
state.T = (tempSlider.value / 100) * T_MAX;
step();
draw();
rafId = requestAnimationFrame(loop);
}
runBtn.addEventListener('click', function() {
running = !running;
runBtn.textContent = running ? 'Pause' : 'Run';
if (running) loop();
else cancelAnimationFrame(rafId);
});
resetBtn.addEventListener('click', function() {
reset();
});
tempSlider.addEventListener('input', function() {
state.T = (tempSlider.value / 100) * T_MAX;
if (!running) draw();
});
window.addEventListener('resize', function() {
ctx = fitCanvas(cv);
stripCtx = fitCanvas(strip);
draw();
});
new MutationObserver(function() {
if (!running) draw();
})
.observe(document.documentElement, {
attributes: true,
attributeFilter: ['data-theme']
});
reset();
})();
/* ============================================================
Widget B: the four-way TSP race
============================================================ */
(function raceDemo() {
var wrap = document.getElementById('race-demo');
if (!wrap) return;
var NAMES = ['Simulated annealing', 'Hill climber', 'Genetic algorithm', 'Random search'];
var SHORT = ['SA', 'Hill', 'GA', 'Rand'];
var MAX_EVALS = 200000;
var runBtn = document.getElementById('raceRun');
var resetBtn = document.getElementById('raceReset');
var speedSlider = document.getElementById('raceSpeed');
var statusEl = document.getElementById('raceStatus');
var tourCanvases = Array.prototype.slice.call(wrap.querySelectorAll('.tourCanvas'));
var scoreEls = Array.prototype.slice.call(wrap.querySelectorAll('.sa-score'));
var chartCv = document.getElementById('raceChart');
var stripCv = document.getElementById('raceStrip');
var tooltip = document.getElementById('raceTooltip');
var tableBody = document.getElementById('raceTable');
var pgCities = document.getElementById('pgCities'),
pgCitiesVal = document.getElementById('pgCitiesVal');
var pgCool = document.getElementById('pgCool'),
pgCoolVal = document.getElementById('pgCoolVal');
var pgMut = document.getElementById('pgMut'),
pgMutVal = document.getElementById('pgMutVal');
var tourCtx = tourCanvases.map(fitCanvas);
var chartCtx = fitCanvas(chartCv);
var stripCtx = fitCanvas(stripCv);
var seed = 20260706,
rng = mulberry32(seed);
var cities = [],
algs = [],
running = false,
rafId = null,
finished = false;
function tourLen(t) {
var L = 0;
for (var i = 0; i < t.length; i++) {
var a = cities[t[i]],
b = cities[t[(i + 1) % t.length]];
L += Math.hypot(a[0] - b[0], a[1] - b[1]);
}
return L;
}
function randTour(r) {
var t = [];
for (var i = 0; i < cities.length; i++) t.push(i);
for (var j = t.length - 1; j > 0; j--) {
var k = Math.floor(r() * (j + 1)),
tmp = t[j];
t[j] = t[k];
t[k] = tmp;
}
return t;
}
function twoOpt(t, r) {
var n = t.length;
var i = 1 + Math.floor(r() * (n - 2));
var j = i + 1 + Math.floor(r() * (n - i - 1));
var nt = t.slice(0, i).concat(t.slice(i, j + 1).reverse(), t.slice(j + 1));
return nt;
}
function makeAlgs() {
var r1 = mulberry32(seed + 1),
r2 = mulberry32(seed + 2),
r3 = mulberry32(seed + 3),
r4 = mulberry32(seed + 4);
var start = randTour(mulberry32(seed + 9));
var startLen = tourLen(start);
var coolSpeed = parseInt(pgCool.value, 10); // decay exponent over full budget
var mutRate = parseInt(pgMut.value, 10) / 100; // per-child swap probability
var T0 = 2 * startLen / cities.length;
// Each algorithm: { evals, best, bestLen, hist:[{e,len}], step(budget) }
function record(a) {
a.hist.push({
e: a.evals,
len: a.bestLen
});
}
var sa = {
evals: 0,
cur: start.slice(),
curLen: startLen,
best: start.slice(),
bestLen: startLen,
hist: [],
pstrip: [],
upP: 0,
upA: 0,
tempAt: function(e) {
// deterministic schedule: T as a fraction of T0 after e evaluations
return Math.exp(-coolSpeed * e / MAX_EVALS);
},
rng: r1,
step: function(budget) {
for (var i = 0; i < budget && this.evals < MAX_EVALS; i++) {
var cand = twoOpt(this.cur, this.rng);
var len = tourLen(cand);
this.evals++;
var T = T0 * this.tempAt(this.evals);
var d = len - this.curLen;
if (d <= 0) {
this.cur = cand;
this.curLen = len;
} else {
this.upP++;
if (T > 1e-9 && this.rng() < Math.exp(-d / T)) {
this.cur = cand;
this.curLen = len;
this.upA++;
}
}
if (len < this.bestLen) {
this.best = cand;
this.bestLen = len;
}
}
}
};
var hc = {
evals: 0,
cur: start.slice(),
curLen: startLen,
best: start.slice(),
bestLen: startLen,
hist: [],
rng: r2,
step: function(budget) {
for (var i = 0; i < budget && this.evals < MAX_EVALS; i++) {
var cand = twoOpt(this.cur, this.rng);
var len = tourLen(cand);
this.evals++;
if (len <= this.curLen) {
this.cur = cand;
this.curLen = len;
}
if (len < this.bestLen) {
this.best = cand;
this.bestLen = len;
}
}
}
};
var ga = (function() {
var POP = 40,
ELITE = 2,
TOUR = 3;
var pop = [],
fit = [];
for (var i = 0; i < POP; i++) pop.push(randTour(r3));
var g = {
evals: 0,
best: null,
bestLen: Infinity,
hist: [],
rng: r3,
pending: 0
};
function evalPop() {
fit = pop.map(function(t) {
g.evals++;
var L = tourLen(t);
if (L < g.bestLen) {
g.bestLen = L;
g.best = t.slice();
}
return L;
});
}
evalPop();
function pick() {
var bi = -1,
bf = Infinity;
for (var k = 0; k < TOUR; k++) {
var c = Math.floor(g.rng() * POP);
if (fit[c] < bf) {
bf = fit[c];
bi = c;
}
}
return pop[bi];
}
function ox(p1, p2) {
var n = p1.length,
i = Math.floor(g.rng() * n),
j = Math.floor(g.rng() * n);
if (i > j) {
var t = i;
i = j;
j = t;
}
var child = new Array(n),
used = {};
for (var k = i; k <= j; k++) {
child[k] = p1[k];
used[p1[k]] = true;
}
var pos = (j + 1) % n;
for (var m = 0; m < n; m++) {
var gene = p2[(j + 1 + m) % n];
if (!used[gene]) {
child[pos] = gene;
pos = (pos + 1) % n;
}
}
return child;
}
g.step = function(budget) {
this.pending += budget;
while (this.pending >= POP && this.evals < MAX_EVALS) {
var next = [];
// elitism: carry the best tours forward untouched
var order = fit.map(function(f, idx) {
return [f, idx];
}).sort(function(a, b) {
return a[0] - b[0];
});
for (var e = 0; e < ELITE; e++) next.push(pop[order[e][1]].slice());
while (next.length < POP) {
var child = ox(pick(), pick());
if (g.rng() < mutRate) {
var a = Math.floor(g.rng() * child.length),
b = Math.floor(g.rng() * child.length);
var tmp = child[a];
child[a] = child[b];
child[b] = tmp;
}
next.push(child);
}
pop = next;
evalPop();
this.pending -= POP;
}
};
return g;
})();
var rs = {
evals: 0,
best: start.slice(),
bestLen: startLen,
hist: [],
rng: r4,
step: function(budget) {
for (var i = 0; i < budget && this.evals < MAX_EVALS; i++) {
var cand = randTour(this.rng);
var len = tourLen(cand);
this.evals++;
if (len < this.bestLen) {
this.best = cand;
this.bestLen = len;
}
}
}
};
[sa, hc, ga, rs].forEach(record);
return [sa, hc, ga, rs];
}
function newCities(n) {
rng = mulberry32(seed);
cities = [];
for (var i = 0; i < n; i++) cities.push([0.06 + rng() * 0.88, 0.08 + rng() * 0.84]);
}
function resetRace(keepCities) {
running = false;
finished = false;
cancelAnimationFrame(rafId);
runBtn.textContent = 'Start race';
if (!keepCities) newCities(parseInt(pgCities.value, 10));
algs = makeAlgs();
statusEl.textContent = 'Press start, or click any map to add a city.';
drawAll();
}
function drawTour(idx) {
var c = vizColors(wrap);
var ctx = tourCtx[idx],
cv = tourCanvases[idx];
var W = cv.clientWidth,
H = cv.clientHeight;
ctx.clearRect(0, 0, W, H);
ctx.strokeStyle = c.grid;
ctx.strokeRect(0.5, 0.5, W - 1, H - 1);
var a = algs[idx];
// tour path
ctx.beginPath();
for (var i = 0; i <= a.best.length; i++) {
var p = cities[a.best[i % a.best.length]];
var X = p[0] * W,
Y = p[1] * H;
if (i === 0) ctx.moveTo(X, Y);
else ctx.lineTo(X, Y);
}
ctx.strokeStyle = c.series[idx];
ctx.lineWidth = 2;
ctx.stroke();
// cities
for (var j = 0; j < cities.length; j++) {
ctx.beginPath();
ctx.arc(cities[j][0] * W, cities[j][1] * H, 3, 0, Math.PI * 2);
ctx.fillStyle = c.ink;
ctx.fill();
}
scoreEls[idx].textContent = a.bestLen.toFixed(2);
}
function drawChart() {
var c = vizColors(wrap);
var W = chartCv.clientWidth,
H = chartCv.clientHeight;
var ctx = chartCtx;
var padL = 44,
padR = 70,
padT = 12,
padB = 26;
ctx.clearRect(0, 0, W, H);
var maxLen = 0,
minLen = Infinity;
algs.forEach(function(a) {
a.hist.forEach(function(h) {
if (h.len > maxLen) maxLen = h.len;
if (h.len < minLen) minLen = h.len;
});
});
if (!isFinite(minLen)) return;
var lo = minLen * 0.95,
hi = maxLen * 1.02;
function X(e) {
return padL + (e / MAX_EVALS) * (W - padL - padR);
}
function Y(v) {
return padT + (1 - (v - lo) / (hi - lo)) * (H - padT - padB);
}
// grid + y ticks
ctx.font = '11px Poppins, sans-serif';
for (var g = 0; g <= 4; g++) {
var v = lo + (g / 4) * (hi - lo),
y = Y(v);
ctx.strokeStyle = c.grid;
ctx.lineWidth = 1;
ctx.beginPath();
ctx.moveTo(padL, y);
ctx.lineTo(W - padR, y);
ctx.stroke();
ctx.fillStyle = c.muted;
ctx.textAlign = 'right';
ctx.fillText(v.toFixed(1), padL - 6, y + 4);
}
// x ticks ("evals" suffix on the last tick names the axis)
ctx.textAlign = 'center';
for (var t = 0; t <= 4; t++) {
var e = (t / 4) * MAX_EVALS;
ctx.fillStyle = c.muted;
ctx.fillText((e / 1000) + 'k' + (t === 4 ? ' evals' : ''), X(e), H - 8);
}
ctx.textAlign = 'left';
// series (best-so-far is a step function; draw as steps)
algs.forEach(function(a, i) {
ctx.beginPath();
var prevY = null;
a.hist.forEach(function(h, k) {
var x = X(h.e),
y = Y(h.len);
if (k === 0) ctx.moveTo(x, y);
else {
ctx.lineTo(x, prevY);
ctx.lineTo(x, y);
}
prevY = y;
});
// extend to current eval count
ctx.lineTo(X(a.evals), prevY);
ctx.strokeStyle = c.series[i];
ctx.lineWidth = 2;
ctx.stroke();
});
// direct labels at line ends (ink text + colored dot), collision-nudged
var ends = algs.map(function(a, i) {
return {
i: i,
y: Y(a.bestLen),
len: a.bestLen
};
})
.sort(function(p, q) {
return p.y - q.y;
});
var lastY = -Infinity;
ends.forEach(function(e) {
lastY = e.y = Math.max(e.y, lastY + 13);
});
var overflow = lastY - (H - padB - 4);
if (overflow > 0) ends.forEach(function(e) {
e.y -= overflow;
});
ends.forEach(function(e) {
var y = e.y;
var x = W - padR + 6;
ctx.beginPath();
ctx.arc(x + 4, y, 3.5, 0, Math.PI * 2);
ctx.fillStyle = c.series[e.i];
ctx.fill();
ctx.fillStyle = c.ink;
ctx.fillText(SHORT[e.i], x + 11, y + 4);
});
}
// the annealer's telemetry, sharing the race chart's x-axis: planned
// cooling schedule (faint amber), temperature spent so far (solid amber)
// and observed share of uphill moves accepted (blue), all on 0-100%
function drawStrip() {
var c = vizColors(wrap);
var W = stripCv.clientWidth,
H = stripCv.clientHeight;
var ctx = stripCtx;
var padL = 44,
padR = 70,
padT = 10,
padB = 10;
ctx.clearRect(0, 0, W, H);
var sa = algs[0];
function X(e) {
return padL + (e / MAX_EVALS) * (W - padL - padR);
}
function Y(v) {
return padT + (1 - v) * (H - padT - padB);
}
ctx.font = '11px Poppins, sans-serif';
[0, 0.5, 1].forEach(function(v) {
ctx.strokeStyle = c.grid;
ctx.lineWidth = 1;
ctx.beginPath();
ctx.moveTo(padL, Y(v));
ctx.lineTo(W - padR, Y(v));
ctx.stroke();
ctx.fillStyle = c.muted;
ctx.textAlign = 'right';
ctx.fillText(Math.round(v * 100) + '%', padL - 6, Y(v) + 4);
});
ctx.textAlign = 'left';
// planned cooling schedule, faint, across the whole budget
ctx.beginPath();
for (var i = 0; i <= 120; i++) {
var e = (i / 120) * MAX_EVALS;
if (i === 0) ctx.moveTo(X(e), Y(sa.tempAt(e)));
else ctx.lineTo(X(e), Y(sa.tempAt(e)));
}
ctx.strokeStyle = c.series[2];
ctx.globalAlpha = 0.3;
ctx.lineWidth = 2;
ctx.stroke();
ctx.globalAlpha = 1;
// temperature actually spent, solid, up to the current evaluation
if (sa.evals > 0) {
ctx.beginPath();
var segs = Math.max(2, Math.round(120 * sa.evals / MAX_EVALS));
for (var k = 0; k <= segs; k++) {
var e2 = (k / segs) * sa.evals;
if (k === 0) ctx.moveTo(X(e2), Y(sa.tempAt(e2)));
else ctx.lineTo(X(e2), Y(sa.tempAt(e2)));
}
ctx.strokeStyle = c.series[2];
ctx.lineWidth = 2;
ctx.stroke();
}
// observed share of uphill moves accepted
if (sa.pstrip.length) {
ctx.beginPath();
sa.pstrip.forEach(function(h, k2) {
if (k2 === 0) ctx.moveTo(X(h.e), Y(h.a));
else ctx.lineTo(X(h.e), Y(h.a));
});
ctx.strokeStyle = c.series[0];
ctx.lineWidth = 2;
ctx.stroke();
}
// live end labels, matching the race chart's style
var labels = [{
y: Y(sa.tempAt(sa.evals)),
color: c.series[2],
text: 'T ' + Math.round(sa.tempAt(sa.evals) * 100) + '%'
}];
if (sa.pstrip.length) {
var lastA = sa.pstrip[sa.pstrip.length - 1].a;
labels.push({
y: Y(lastA),
color: c.series[0],
text: 'uphill ' + Math.round(lastA * 100) + '%'
});
}
labels.sort(function(p, q) {
return p.y - q.y;
});
labels.forEach(function(l) {
l.y = Math.max(padT + 5, Math.min(H - padB - 3, l.y));
});
if (labels.length === 2 && labels[1].y - labels[0].y < 13) labels[0].y = labels[1].y - 13;
labels.forEach(function(l) {
var x = W - padR + 6;
ctx.beginPath();
ctx.arc(x + 4, l.y, 3.5, 0, Math.PI * 2);
ctx.fillStyle = l.color;
ctx.fill();
ctx.fillStyle = c.ink;
ctx.fillText(l.text, x + 11, l.y + 4);
});
}
function drawTable() {
var c = vizColors(wrap);
var leader = Math.min.apply(null, algs.map(function(a) {
return a.bestLen;
}));
var rows = algs.map(function(a, i) {
return {
i: i,
len: a.bestLen
};
})
.sort(function(p, q) {
return p.len - q.len;
});
tableBody.innerHTML = rows.map(function(r) {
var gap = ((r.len / leader - 1) * 100);
return '<div class="kr-stat"><span class="kr-stat-lbl">' +
'<span class="kr-swatch" style="background:' + c.series[r.i] + ';"></span>' +
NAMES[r.i] + '</span><span class="kr-stat-val">' + r.len.toFixed(2) +
' <span style="color:var(--viz-muted); font-weight:400;">' +
(gap < 0.005 ? 'leader' : '+' + gap.toFixed(1) + '%') + '</span></span></div>';
}).join('');
}
function drawAll() {
algs.forEach(function(_, i) {
drawTour(i);
});
drawChart();
drawStrip();
drawTable();
}
var recordEvery = MAX_EVALS / 400;
function loop() {
if (!running) return;
var budget = parseInt(speedSlider.value, 10);
algs.forEach(function(a) {
var before = a.evals;
a.step(budget);
if (Math.floor(a.evals / recordEvery) > Math.floor(before / recordEvery)) {
a.hist.push({
e: a.evals,
len: a.bestLen
});
if (a.pstrip) {
a.pstrip.push({
e: a.evals,
a: a.upP ? a.upA / a.upP : 0
});
a.upP = 0;
a.upA = 0;
}
}
});
drawAll();
var done = algs.every(function(a) {
return a.evals >= MAX_EVALS;
});
if (done) {
running = false;
finished = true;
runBtn.textContent = 'Start race';
var leader = algs.slice().sort(function(p, q) {
return p.bestLen - q.bestLen;
})[0];
statusEl.textContent = 'Race finished. ' + NAMES[algs.indexOf(leader)] + ' wins. Press "New cities" to go again.';
algs.forEach(function(a) {
a.hist.push({
e: a.evals,
len: a.bestLen
});
if (a.pstrip) {
a.pstrip.push({
e: a.evals,
a: a.upP ? a.upA / a.upP : 0
});
a.upP = 0;
a.upA = 0;
}
});
drawAll();
return;
}
statusEl.textContent = Math.round(algs[0].evals / 1000) + 'k / ' + (MAX_EVALS / 1000) + 'k evaluations';
rafId = requestAnimationFrame(loop);
}
runBtn.addEventListener('click', function() {
if (finished) resetRace(true);
running = !running;
runBtn.textContent = running ? 'Pause' : 'Resume';
if (running) loop();
else {
cancelAnimationFrame(rafId);
statusEl.textContent = 'Paused.';
}
});
resetBtn.addEventListener('click', function() {
seed += 7;
resetRace(false);
});
tourCanvases.forEach(function(cv) {
cv.addEventListener('click', function(ev) {
if (cities.length >= 80) return;
var rect = cv.getBoundingClientRect();
cities.push([(ev.clientX - rect.left) / rect.width, (ev.clientY - rect.top) / rect.height]);
resetRace(true);
statusEl.textContent = cities.length + ' cities, race reset. Press start.';
});
});
pgCities.addEventListener('input', function() {
pgCitiesVal.textContent = pgCities.value;
});
pgCities.addEventListener('change', function() {
resetRace(false);
});
function updateCool() {
pgCoolVal.textContent = (parseInt(pgCool.value, 10) / 10).toFixed(1) + '×';
}
function updateMut() {
pgMutVal.textContent = pgMut.value + '%';
}
pgCool.addEventListener('input', updateCool);
pgCool.addEventListener('change', function() {
resetRace(true);
});
pgMut.addEventListener('input', updateMut);
pgMut.addEventListener('change', function() {
resetRace(true);
});
updateCool();
updateMut();
// chart hover tooltip
chartCv.addEventListener('mousemove', function(ev) {
var rect = chartCv.getBoundingClientRect();
var padL = 44,
padR = 62;
var frac = (ev.clientX - rect.left - padL) / (rect.width - padL - padR);
if (frac < 0 || frac > 1) {
tooltip.style.display = 'none';
return;
}
var e = frac * MAX_EVALS;
var c = vizColors(wrap);
var lines = algs.map(function(a, i) {
var best = null;
for (var k = 0; k < a.hist.length; k++) {
if (a.hist[k].e <= e) best = a.hist[k].len;
else break;
}
return '<span class="kr-swatch" style="background:' + c.series[i] + '; margin-right:6px;"></span>' +
SHORT[i] + ': ' + (best === null ? ', ' : best.toFixed(2));
});
var accAt = null;
for (var k3 = 0; k3 < algs[0].pstrip.length; k3++) {
if (algs[0].pstrip[k3].e <= e) accAt = algs[0].pstrip[k3].a;
else break;
}
tooltip.innerHTML = '<strong>' + Math.round(e / 1000) + 'k evals</strong><br>' + lines.join('<br>') +
'<br><span style="color:var(--viz-muted);">SA telemetry: T ' + Math.round(algs[0].tempAt(e) * 100) + '%' +
(accAt === null ? '' : ', uphill ' + Math.round(accAt * 100) + '%') + '</span>';
tooltip.style.display = 'block';
var tx = ev.clientX - rect.left + 14;
if (tx + 130 > rect.width) tx = ev.clientX - rect.left - 144;
tooltip.style.left = tx + 'px';
tooltip.style.top = (ev.clientY - rect.top + 10) + 'px';
});
chartCv.addEventListener('mouseleave', function() {
tooltip.style.display = 'none';
});
window.addEventListener('resize', function() {
tourCtx = tourCanvases.map(fitCanvas);
chartCtx = fitCanvas(chartCv);
stripCtx = fitCanvas(stripCv);
drawAll();
});
new MutationObserver(function() {
drawAll();
})
.observe(document.documentElement, {
attributes: true,
attributeFilter: ['data-theme']
});
newCities(parseInt(pgCities.value, 10));
resetRace(true);
})();
})();
Common questions
Is the annealer guaranteed to find the best tour?
In theory, with an infinitely slow logarithmic cooling schedule, yes, there's a lovely proof. In practice nobody has infinite time, so real schedules trade the guarantee for speed and settle for "excellent, quickly." On these maps the annealer routinely gets within a few percent of optimal; certifying the optimum is a different (and much more expensive) sport, played with exact solvers like Concorde.
Why does the GA lose here? Your other posts defend GAs!
Because this problem is small and 2-opt local moves are unusually powerful on Euclidean TSP, the landscape suits move-based searchers. Change the terrain (add time windows, vehicle capacities, multiple objectives, a simulator in the loop) and population methods perform better, generally. No Free Lunch theorem: the winner is a property of the landscape, not the algorithm. Never trust a benchmark with one problem on it, including mine.
What cooling schedule does the demo use?
Exponential decay: temperature starts near the average edge length of a random tour and decays smoothly so it's effectively frozen by the end of the 200,000-evaluation budget. The playground's "cooling speed" scales that decay exponent.
References
- Kirkpatrick, S., Gelatt, C. D., & Vecchi, M. P. (1983). Optimization by simulated annealing. Science, 220(4598), 671–680. https://doi.org/10.1126/science.220.4598.671
- Černý, V. (1985). Thermodynamical approach to the travelling salesman problem: An efficient simulation algorithm. Journal of Optimization Theory and Applications, 45, 41–51. https://doi.org/10.1007/BF00940812
- Metropolis, N., Rosenbluth, A. W., Rosenbluth, M. N., Teller, A. H., & Teller, E. (1953). Equation of state calculations by fast computing machines. The Journal of Chemical Physics, 21(6), 1087–1092. https://doi.org/10.1063/1.1699114
- Croes, G. A. (1958). A method for solving traveling-salesman problems. Operations Research, 6(6), 791–812. https://doi.org/10.1287/opre.6.6.791