Technology · · 5 min read
How the Interactive Posts Work
Several blogs I've written run simulations in your browser. The chassis underneath them: theme-reactive canvases, seeded randomness, phone-width rules, and a smoke test.
Photograph © Ken Reid
How the Interactive Posts Work
Someone on Cyberspace (new social media website that has such a cool vibe to it) recently asked me how I set up the simulators on my website, if I used a specific library. I responded saying how it's raw javascript, but that got me thinking: I intend to keep making these kind of educational and fun blogs, so why not make a little framework to make it easier on myself?
The algorithms themselves need to be separate, I wasn't planning on making a new JMetal, DEAP or similar. Part of the series on how this site is built.
Quick jargon guide
- Canvas: an HTML element that gives JavaScript a rectangle of pixels to draw on, every frame, with no memory of what was there before.
- devicePixelRatio: how many physical screen pixels sit behind one CSS pixel. Ignoring it can cause canvas drawings to come out blurry on phones and retina displays.
- CSS custom properties: variables that live in stylesheets (
--viz-ink: #2b2b2b). Scripts can read them at runtime, which is the hinge this whole system turns on. - MutationObserver: a browser API that fires a callback when part of the page changes, like an attribute being flipped by a theme toggle.
- Seeded RNG: a random number generator that produces the same "random" sequence every time you start it from the same seed.
- requestAnimationFrame: the browser's "call me before the next repaint" scheduler, the correct heartbeat for animation loops.
The CSS owns the colours
I always enjoyed color theory in computer science. The RGB values, pixels (did you know it stands for "picture element"?), bitmaps vs JPEGs vs other formats, it's super interesting to me. On this website, the theme toggle cannot restyle a canvas the way it restyles text, and the first version of the ant post hardcoded its colours in JavaScript and looked wrong in one theme or the other. Every widget's colours live on its wrapper element as CSS custom properties, set for both themes in one place in the stylesheet, and the little framework, js/kr-viz.js, reads them and hands them to the drawing code as ctx.colors. Before it existed, every post carried its own copy of the function that reads them: sixteen copies, in five slightly different versions. Here's the one that's left, and the observer that rereads it:
var TOKENS = ['s1', 's2', 's3', 's4', 's5', 's6', 's7', 's8',
              'ink', 'muted', 'grid', 'surface', 'border', 'cell'];

function readColors(el) {
  var cs = getComputedStyle(el), out = {};
  for (var i = 0; i < TOKENS.length; i++) {
    out[TOKENS[i]] = cs.getPropertyValue('--viz-' + TOKENS[i]).trim();
  }
  return out;
}

new MutationObserver(function () {
  colors = readColors(root);
  ctx.colors = colors;
  redraw();
}).observe(document.documentElement, {attributes: true, attributeFilter: ['data-theme']});
The observer redraws the moment data-theme gets toggled, so a running simulation changes palette mid-run. This has no practical value whatsoever.
Randomness must be reproducible
Math.random() is banned from the demos. Every widget gets its randomness from ctx.rng(), which is mulberry32, a seeded generator inside the framework:
function mulberry32(seed) {
  var a = seed >>> 0;
  return function () {
    a |= 0; a = (a + 0x6D2B79F5) | 0;
    var t = Math.imul(a ^ (a >>> 15), 1 | a);
    t = (t + Math.imul(t ^ (t >>> 7), 61 | t)) ^ t;
    return ((t ^ (t >>> 14)) >>> 0) / 4294967296;
  };
}
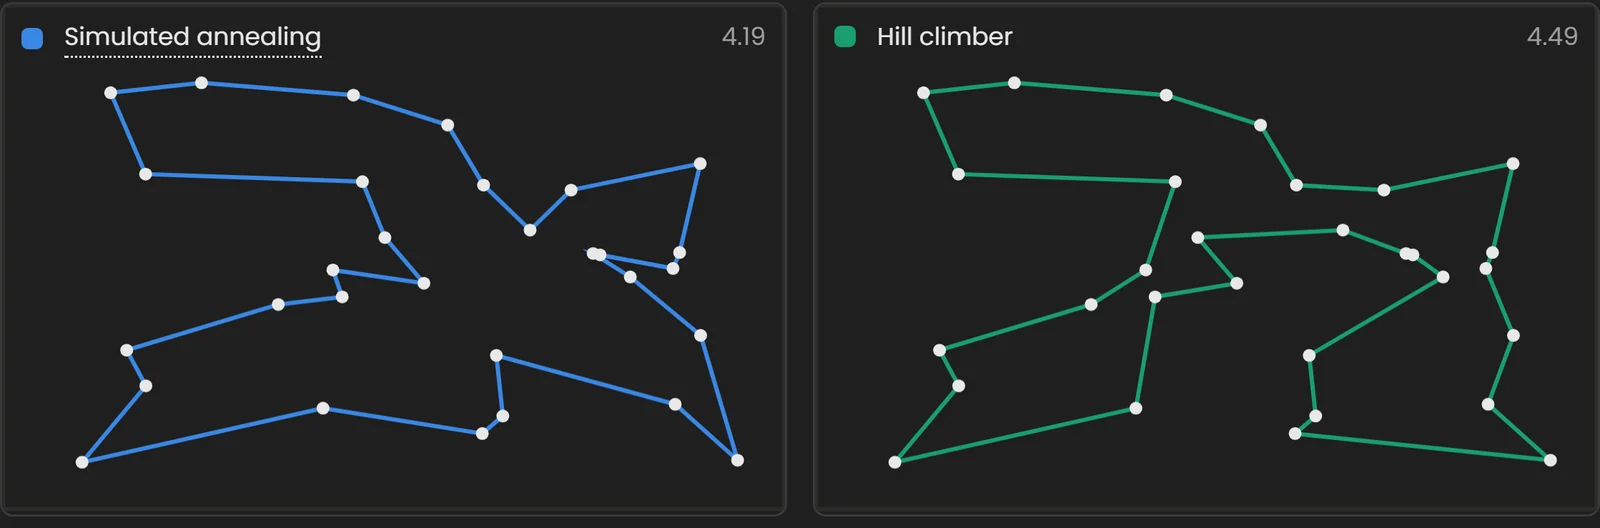
When a reader reports that the race chart does something odd around 90,000 evaluations, I can watch the same 90,000 evaluations they did. "New cities" buttons just bump the seed.
Phones are the real test
No canvas ever gets a fixed rendered height now: the framework computes height from measured width, so narrow screens get a taller aspect instead of a squashed ribbon. It also caps the pixel density at 2, because a 3x phone would otherwise redraw nine pixels for every one it shows, every frame, for detail nobody can see at that size. Side-by-side panes stack vertically below ~480px, and sliders become full-width rows on small screens.
A canvas only gets touch-action: none if it has drag interaction, so chart canvases never trap a reader mid-scroll.
And because rules I merely remember are rules I eventually break, the test suite enforces them. The smoke test auto-discovers every blog page containing a <canvas> tag (no registration list to forget to update) and loads each at 360px wide in a headless browser. It fails the build on horizontal overflow, a canvas wider than the viewport, a canvas squashed under 100px tall, or any console error.
The chassis checklist
What every new interactive post starts from:
- A
.kr-vizwrapper with empty slots for the toolbar, the sliders and the stat tiles, which the framework fills. The--viz-*palette comes from the stylesheet; a post that wants other series colours sets them on its own wrapper, in both themes. - One call:
KRViz.mount(target, {canvases, buttons, controls, stats, charts, init, step, draw}). The post keepsinit,stepanddraw, the algorithm and the drawing, as plain functions you can read in view-source. The framework does the rest: it sizes the canvases, rereads the colours on a theme flip, and runs the loop. ctx.rng()for every random draw, from a seed in the options.- Speed in steps per second, the same in every demo; the framework works out how many steps to run in each frame.
role="img"and a realaria-labelon every canvas.
Common questions
Why raw canvas instead of a chart library?
The demos ARE the content, and libraries make the common case easy at the price of making the odd case a bit more awkward. A four-way race chart with collision-nudged end labels, step-function lines, and a temperature strip sharing its x-axis is the odd case.
Don't the simulations drain phone batteries?
They start by themselves, but only run while they're on screen: the framework pauses a demo when it scrolls out of view and picks it up again when it comes back, unless you paused it yourself. If your system asks for reduced motion, they wait for you to press Play. They also do their work inside a requestAnimationFrame budget, so the browser throttles them in background tabs.
Why not SVG, which the theme could style directly?
SVG restyles beautifully but costs per element, and these simulations push thousands of points and segments per frame.